Lightcurve Animations#
import sys
import numpy as np
import matplotlib.pyplot as plt
from IPython.display import HTML
sys.path.append("../..")
from spotgp import (
TrapezoidSymmetricEnvelope,
VisibilityFunction,
SpotEvolutionModel,
LightcurveModel,
)
np.random.seed(42)
Build a SpotEvolutionModel#
A SpotEvolutionModel combines three independent components:
Component |
Class |
Key parameters |
|---|---|---|
Spot size evolution |
|
|
Stellar geometry |
|
|
Amplitude |
|
|
LightcurveModel.from_spot_model additionally accepts:
Parameter |
Default |
Description |
|---|---|---|
|
— |
Total number of spots in the simulation |
|
— |
Simulation duration [days] |
|
— |
Sampling cadence [days] |
|
|
Longitude range for spot placement [rad] |
|
from |
Latitude range for spot placement [rad] |
envelope = TrapezoidSymmetricEnvelope(
lspot=10.0, # plateau duration [days]
tau_spot=5.0, # rise/decay timescale [days]
)
visibility = VisibilityFunction(
peq=5.0, # equatorial rotation period [days]
kappa=0.3, # differential rotation shear
inc=np.pi / 3, # stellar inclination [rad]
)
model = SpotEvolutionModel(
envelope=envelope,
visibility=visibility,
nspot_rate=0.4, # spots per day
alpha_max=0.05, # peak spot angular radius [rad]
fspot=0.0, # spot contrast
)
print("param_keys:", model.param_keys)
print(model)
param_keys: ('peq', 'kappa', 'inc', 'lspot', 'tau_spot', 'sigma_k')
SpotEvolutionModel(
envelope=TrapezoidSymmetricEnvelope({'lspot': 10.0, 'tau_spot': 5.0}),
visibility=VisibilityFunction(peq=5.0, kappa=0.3, inc=1.047),
sigma_k=0.00158113883008419
)
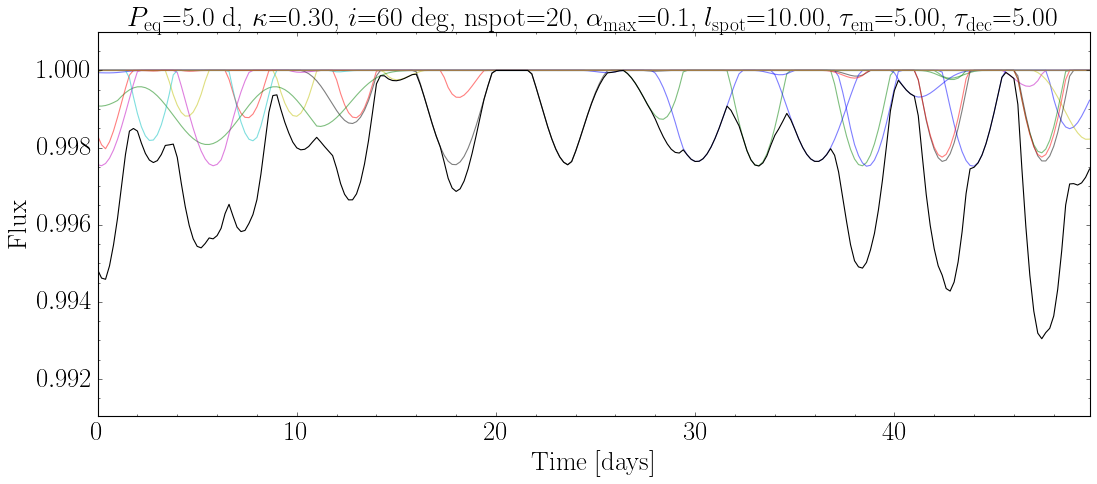
Simulate a lightcurve#
lc = LightcurveModel.from_spot_model(
spot_model=model,
nspot=20,
tsim=50,
tsamp=0.2,
long=[0, 2 * np.pi],
)
lc.plot_lightcurve()
Create an animation of the star rotation and lightcurve#
anim = lc.animate_lightcurve(fps=10, dpi=150, duration=12,
outfile="lightcurve_animation.gif",
save_last_frame="lightcurve_final_frame.png")
HTML(anim.to_jshtml())
Rendering 120 frames to lightcurve_animation.gif...
Done.
Last frame saved to lightcurve_final_frame.png
Animation size has reached 21108903 bytes, exceeding the limit of 20971520.0. If you're sure you want a larger animation embedded, set the animation.embed_limit rc parameter to a larger value (in MB). This and further frames will be dropped.